
The big question
I’m sure you’ve seen the claim online that a camera with a 14-bit RAW cannot have more than 14 stops of dynamic range. The above graphic consists of a synthetic stop chart quantized to just 4 bits in linear, then SRGB encoded for your display. It clearly shows more than 4 stops of dynamic range, so let’s break it down.
Contents:
Technical Background
For those of you who are familiar with these concepts, please feel free to skip to the original research portion of this article.
What is dynamic range?
In its simplest form, dynamic range represents the ratio between the largest signal and the smallest nonzero signal, where the largest signal is distinguishable from all inputs less than it, and the smallest signal is the smallest input distinguishable from both zero and from greater inputs.
Signal to Noise Ratio
Signal to noise ratio (SNR) is defined by the ratio between the incoming signal and the standard deviation of that signal. In practice, images are noisy for a variety of reasons (shot noise and read noise are the usual suspects), and parts of the image that have low SNR are typically not going to be acceptably recovered in post. It follows therefore that in practice, we should define the “smallest input distinguishable from zero” as “smallest signal whose SNR exceeds some threshold”, allowing us to choose how distinguishable this signal must be relative to zero. The signal and its standard deviation are measured in linear.
CineD typically reports dynamic range measurements from the IMATEST Xyla 21 test chart, with a threshold of \(\text{SNR} \geq 2.0\), meaning they report the quantity of stops of dynamic range between clipping and the SNR of 2.0.
What is bit depth?
An image can be represented by a number for each channel at each pixel. As computers have limited memory, each of these numbers is held in memory with a fixed quantity of bits. You can think of it like the odometer in an older car (Image courtesy of Wikipedia):
When there are a limited number of digits, there are a finite quantity of numbers that can be represented. In the case of \(N\) digits, there are \(10^N\) different numbers you can encode; in the above odometer, there are 6 digits and can represent the 1,000,000 values from 000000 to 999999.
With binary numbers, an \(N\) bit number can have \(2^N\) different values, so if we had 6 bits, we could go from b000000 to b1111111. There are several different ways we can map these \(2^N\) different representations to real numbers: unsigned integers, one’s complement signed integers, two’s complement signed integers, floating point numbers, and fixed point numbers are the most commonly discussed. For the purpose of this blog post, we’ll only discuss unsigned integers and fixed point numbers.
Looking back on the odometer above, you can see that it’s tracking values between 000000 and 999999, as an unsigned2 integer whole number. However, some odometers from the time had a decimal point drawn one digit from the right. If the screen still only had six digits in total, it would then be able to show you numbers between 00000.0 and 99999.9. This is what “fixed point” numbers is all about: you have \(N\) bits but you assign \(M\) of them to be after the decimal point, so you can represent fractional values with a “fixed” amount of precision. This comes at the expense of having fewer bits/digits remaining for the integer portion of the representation, limiting the overall range.
Many videos are encoded as 8-bit files. That means that as an unsigned integer, all pixels will be values between b00000000 and b11111111, or 0 to 2553. However, we may be inclined to say that this is a fixed point representation from 0 to 1.0, where 255 maps to 1.0. For the rest of this article, we’ll assume that we’re handling the unsigned integer representation.
What are log and linear encodings?
Linear encodings are those where the number (or Code Value) associated with a photosite or pixel is directly proportional to the amount of energy caught by the corresponding part of the sensor over the course of its exposure. This means that if the duration of the exposure was doubled, the code value would likewise also be doubled. In color grading, linear is typically scaled so that 0.18 represents a proper exposure of a mid gray card, but RAW files are typically scaled so that the clipping point of the sensor is at or close to the format’s max value: \((2^N - 1)\) for an \(N\) bit unsigned integer format.
Observe that because doubling of the photographed light means that the the code value is doubled, each additional stop of light requires twice as many code values as the previous.
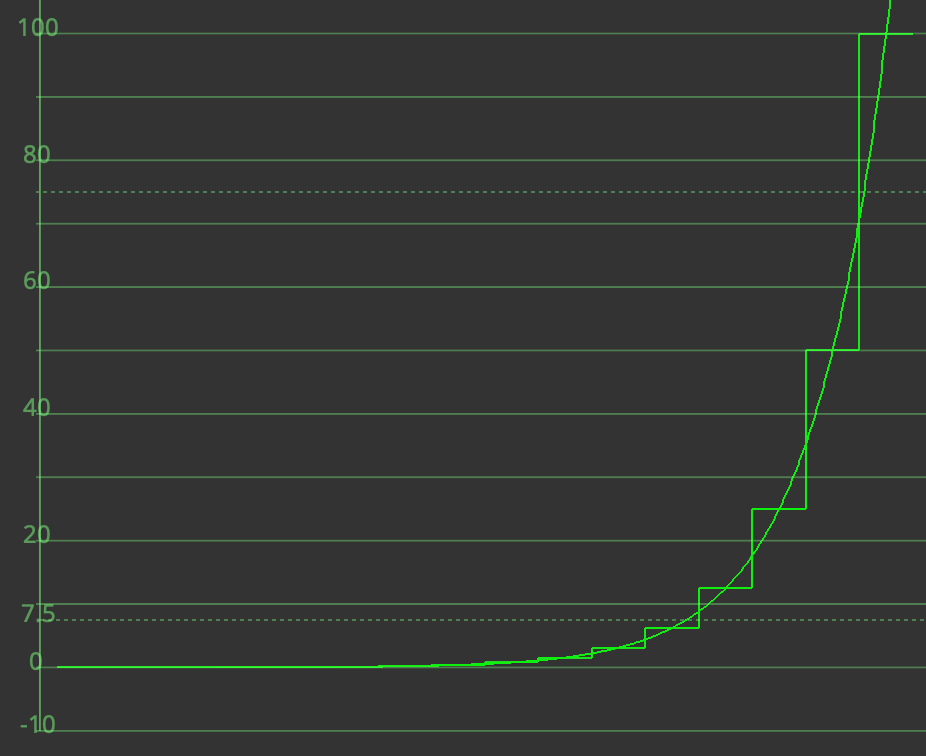
Below is a screenshot of a waveform for a linear chart depicting chips in one-stop increments below 100%.
Log encodings are those where a logarithm function has been applied to the Linear signal, often with some additional scaling. The function is often piece-wise, meaning that the behavior in the shadows differs from that of the highlights. For reference, the ACEScct encoding (from linear) is reproduced below and has this construction:
const float X_BRK = 0.0078125;
const float Y_BRK = 0.155251141552511;
const float A = 10.5402377416545;
const float B = 0.0729055341958355;

float lin_to_ACEScct(float in)
{
    if (in <= X_BRK)
        return A * in + B;
    else // (in > X_BRK)
        return (log2(in) + 9.72) / 17.52;
}
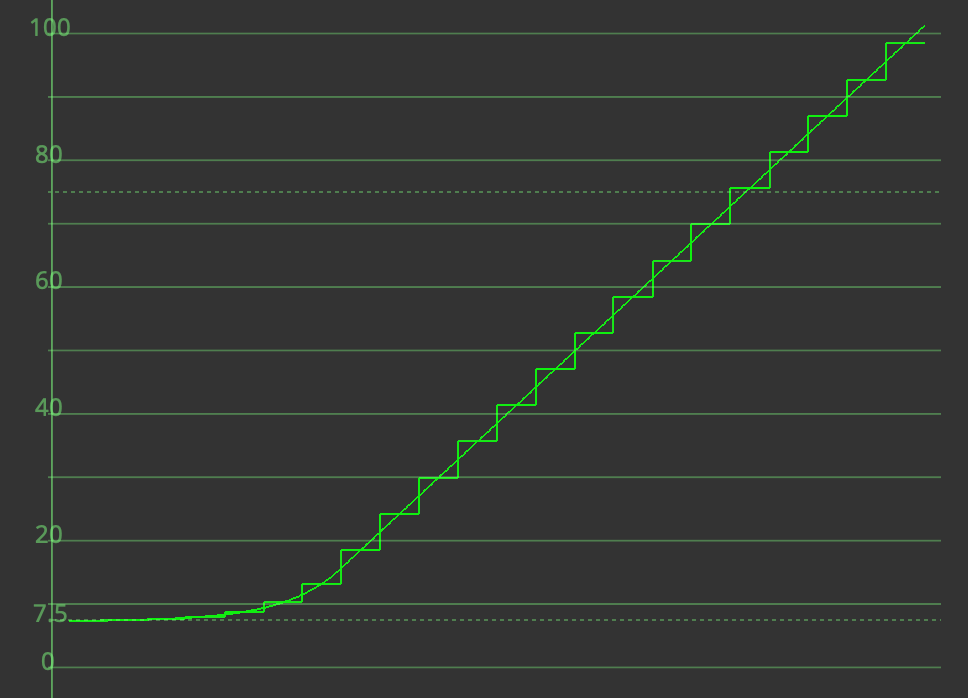
The below waveform shows how one-stop increments are encoded in ACEScct. Note that the number of code values between each stop is roughly constant, particularly in the highlights (in > X_BRK).
Quantization methodologies
Quantization refers to the process of reducing the precision of a number. In doing so, the difference between the original number and the new, precision-reduced number represents the quantization error and is a source of noise.
By tradition, if we want to go to 10-bit video, we simply round to the nearest 10-bit code value, using something like the following code:
__DEVICE__ float round(float in) {
    // If we were rounding to 10-bit, `in` would be in the range of 0.0 to 1023.0
    if (in - _floorf(in) < 0.5) {
        return _floorf(in);
    } else {
        return _ceil(in);
    }
}
However, by recalling that the image has more than one pixel in it, we can actually do much better through a dithering approach I call “Stochastic rounding”. This is implemented by the following DCTL code:
__DEVICE__ float stochastic_round(float in, __PRIVATE__ rand_state* seed) {
    float threshold = in - _floorf(in);
    float out;
    if (randu(seed) > threshold) {
        out = _floorf(in);
    } else {
        out = _ceilf(in);
    }
    return out;
}
To go through an example, if we have a number like 512.3 that we want to round to an integer in the range of 0 - 1023, then we look at how far 512.3 is from 512 and 513, and we round up with probability 0.3 and round down with probability 0.7. This means that on average, the resulting code value will be equal to 512.3, and appear as 512.3 if this is repeated on many independent pixels.
In the cover picture, I used stochastic rounding to quantize the bottom half of the stops chart while in linear to 4 bits using this methodology, and then encoded the image to sRGB. I think we can agree that there are more than four distinguishable stops of dynamic range in that image.4
What happens if you quantize in linear or in log?
The average video camera pipeline will pull the image off the sensor in a linear state, with each photosite quantized to 12 to 16 bits. Afterwards, it will typically debayer and then apply a log encoding to each channel in each pixel, before writing to a file where the encoding process incurs another quanitzation step of typically 8 to 12 bits (some steps omitted for simplicity). Both of these quantization steps introduce quantization errors, but the impact of the errors differs for the two steps.
Quantization of a noiseless image in linear to \(N\) bits with the “Round” methodology will result in a representation where the dynamic range is at best \(\log_2 ((2^N - 1) : 1) \approx N\) stops. This is what people refer to online when they say that a \(N\)-bit RAW file can have at most \(N\) stops of dynamic range, but in reality the RAW file is dithered through shot noise and other noise sources, so this doesn’t tell the whole story. Plus, even for a noiseless image, in the best case scenario, we can use “Stochastic rounding” instead of the naive rounding approach. See the below section for more details on that.
Quantization in log will typically result in increased banding. If the quantization error exceeds the strength (I believe measured by standard deviation, but I have not verified) of the noise sources within the image, banding will become visible.5 It’s worth noting that you can store outrageous amounts of dynamic range in the 0-100% range through the choice of log curve, but as the dynamic range increases, the quantization will result in more severe banding.
Dynamic range of linear, integer signals
Consider a synthetic linear signal stored as a 10-bit integer. Such an integer will lie in the range 0 to 1023 (or you could say 0/1023 to 1023/1023), and thus under the “Rounding” methodology, we would traditionally assume the dynamic range of the signal is limited to 1023:1, almost exactly 10 stops.
If we instead use stochastic rounding, we can extend the visible gradient below the 1/1023 code value.
How much noise does stochastic rounding introduce?
So suppose we have a one-bit representation and we want to store \(x\), which is between 0 and 1. Using my stochastic rounding method, this is a Bernoulli random variable with probability \(x\). The variance will be:
\[\text{var}(x) = x(1 - x)\]and thus the signal to noise ratio is
\[\text{SNR}(x) = \frac{x}{\sqrt{x(1 - x)}}\]You can explore this calculation here: Desmos.
The SNR of \(x\) is reproduced in the below plot, where \(x\) is on the x-axis and SNR is on the y-axis:
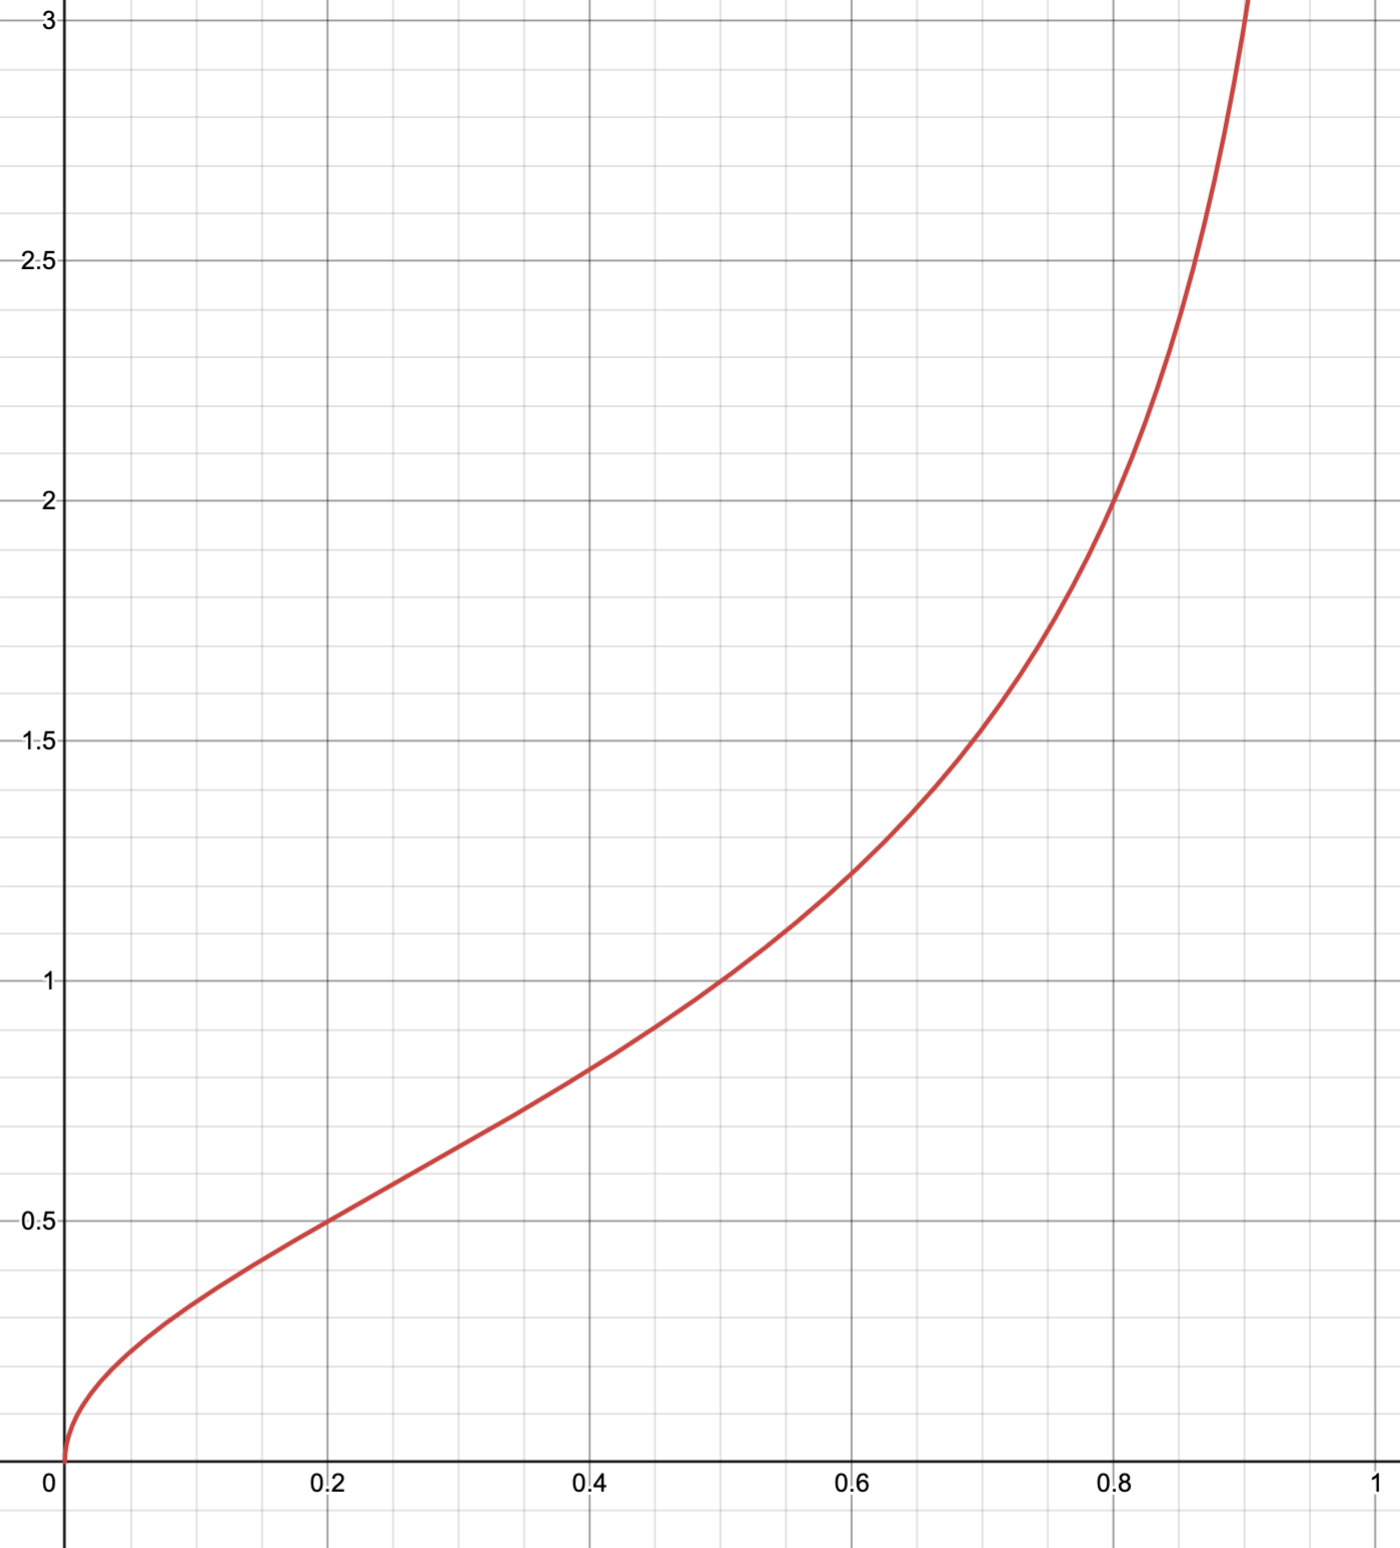
You can see that the SNR increases with \(X\), and due to \(\text{var}(x)\) approaching zero as at \(x \rightarrow 1\), it approaches infinity. Most importantly, the accepted threshold of \(\text{SNR} = 2.0\) (as well as any other SNR threshold) exists with \(x < 1.0\), so the denominator “smallest distinguishable signal” in the dynamic range calculation can be less than 1.
Analysis
We can see from the above Desmos some key values:
| Code Value | SNR |
|---|---|
| \(x = 0.2\) | \(\text{SNR} = 0.5\) |
| \(x = 0.5\) | \(\text{SNR} = 1.0\) |
| \(x = 0.8\) | \(\text{SNR} = 2.0\) |
We can see that if we quantized linear \(x\) to unsigned integer code values between 0 and 1023, then inputs of \(0.8 \leq x \leq 1023\) would have an SNR exceeding 2.0, the CineD target. We can then compute log2(1023 / 0.8) and this gives us 10.32 stops of dynamic range. Following the logic for the three rows at \(N\) bits, we can say:
| SNR | Approx Upper Bound Dynamic Range (Stops) |
|---|---|
| \(\text{SNR} \geq 0.5\) | \(N + 2.32\) stops |
| \(\text{SNR} \geq 1.0\) | \(N + 1.00\) stops |
| \(\text{SNR} \geq 2.0\) | \(N + 0.32\) stops |
Conclusion
It is worth noting that this dynamic range figure is going to serve as an upper bound, and in practice, your camera will not reach it. However, it is worth noting the implication that if your noise tolerance is an SNR of 1.0 or 0.5, then your \(N\) bit linear container may allow for significantly more than \(N\) stops of dynamic range that meet your noise tolerance.
-
The
brepresents that the number is a binary representation. ↩ -
“Unsigned” means that there’s no “sign” bit, which indicates whether the number is positive or negative. Unsigned integers are therefore all nonnegative. ↩
-
In practice, signals are frequently squeezed into Video levels, only allowing usage of the
16-235range, which is then stretched out to0 to 255. ↩ -
Note that the visual impact of quantizing in linear will differ from quantizing in log. Having an unchanged expected value in linear does not necessarily mean that the image will appear to be the same; you would likely want to quantize to an integer representation only under a logarithmic encoding, given the option, if you want to minimize visually obvious effects. ↩
-
Also, because most codecs are YCbCr, the chroma channels tend to get quantized to the same precision (though a reduced resolution) as the Y channel in log images. The log encoding and choice of primaries typically results in a very weak chroma signal, so the chroma channels experience quite large quantization errors that are predictive of the poor color information and splotchy orange and purple blobs on most 8-bit log codecs. ↩